
Figure 8.
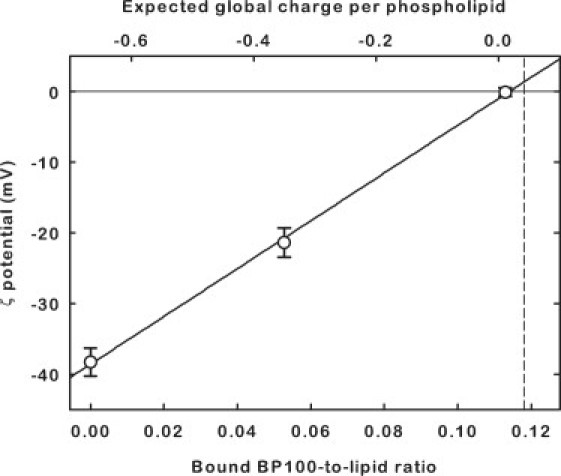
The ζ-potential of 250 μM 2:1 POPG/POPC LUV in the presence of different BP100 concentrations (error bars represent SD). Peptide concentrations are displayed either as bound peptide/lipid ratios (calculated with the partition constant obtained from Eq. 3) or as the estimated global charge per phospholipid assuming a 6+ charge on the peptide. A linear regression of the points is displayed as a guide to the eye. The saturation ratio is indicated by the dashed line. A neutralization of the LUV charge at the saturation point was observed, in agreement with what was expected from the saturation proportion (Fig. 3), the peptide charge, and the composition of the system.