
Figure 5.
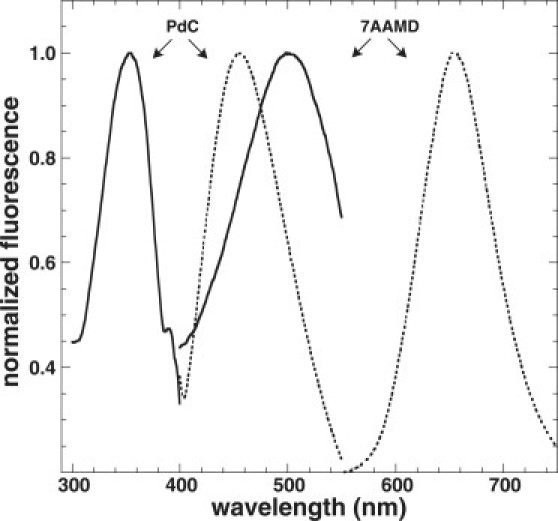
Steady-state spectra for the FRET donor (6PdC) and acceptor (7AAMD). The excitation spectra are indicated by solid lines, and the emission spectra are indicated by dashed lines. Note the overlap between PdC emission and 7AAMD excitation, which makes them candidates for FRET donor-acceptor pairs.