
Figure 6.
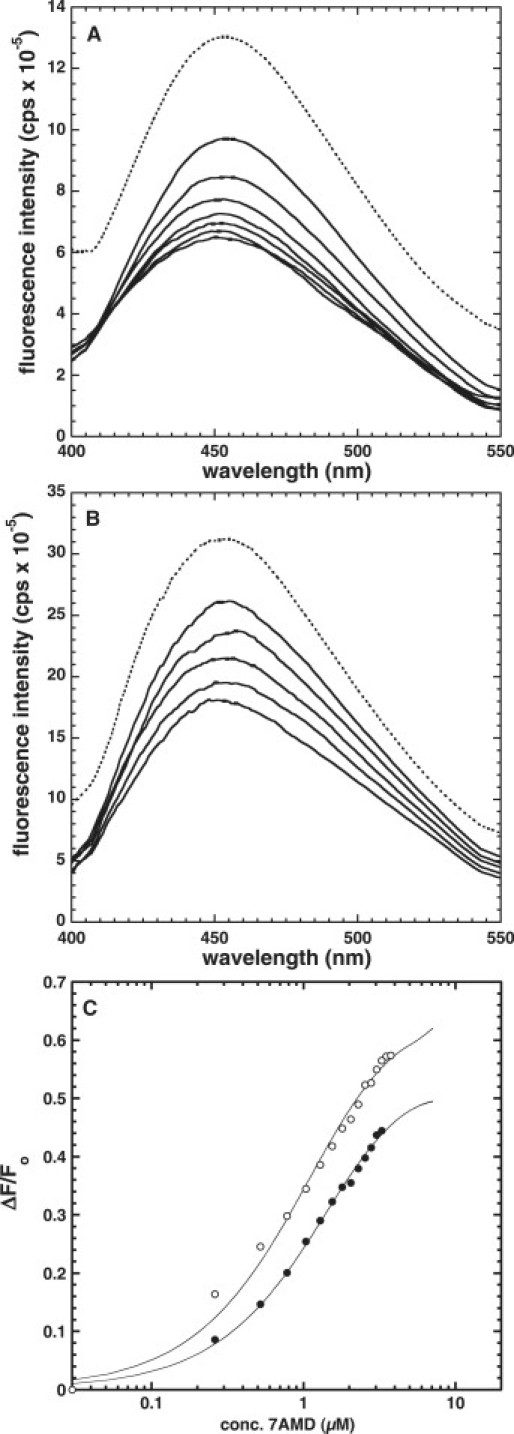
Quenching of PdC fluorescence upon addition of 7AAMD. The spectra were collected with excitation wavelength at 345 nm. The initial fluorescence of 6PdC (A) and 7PdC (B) is shown as dashed lines, whereas solid lines indicate a decrease in fluorescence. Titration curves derived from the data are shown in C for (•) 6PdC and (○) 7PdC. Fitting of these titration curves gives values for Kd identical to those recorded in Table 2.