
Figure 5.
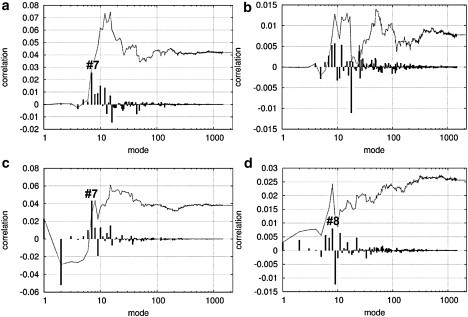
Correlation functions between (a) opening of switch I and closing of the actin-binding site (C12 = 0.042, = 0.015); (b) opening of switch II and closing of the actin-binding site (C12 = 0.0078, = 0.0098); (c) opening of switch I and downward rotation of the converter (C12 = 0.038, = 0.013); and (d) opening of switch II and downward rotation of the converter (C12 = 0.026, = 0.011). The solid line shows the cumulative correlation as a function of the cutoff mode (see Methods), and the impulses show the contributions from each mode (see Methods). The mode number is shown in logarithmic scale to clearly illustrate the positions and contributions of low-frequency modes.