
Figure 4.
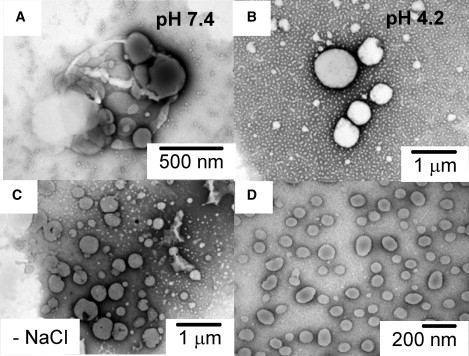
Negative-staining TEM images of DOBMP showing effects of pH and salt. (A) Dispersions hydrated in HEPES buffer with 100 mM NaCl. (B) Dispersions hydrated in NaOAc buffer with 100 mM NaCl. (C) Dispersions hydrated in HEPES buffer with no NaCl. (D) Same sample as in C but passed through 400-nm extrusion membranes. The clustered structure of the dispersions is not seen under acidic conditions or under low ionic strength. Magnifications vary and are indicated in each figure.