
Figure 2.
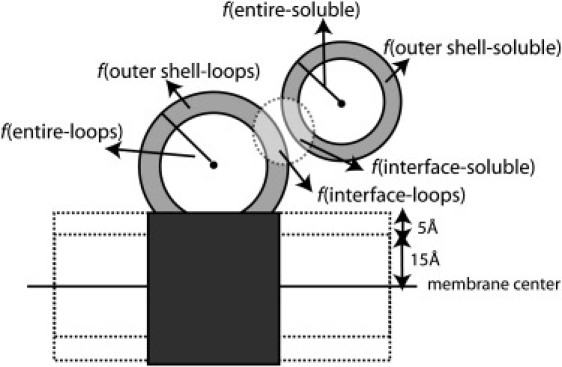
Illustration of the different regions of a membrane protein-soluble protein complex. The loops are defined beyond the central layer (±15 Å). The interface and the outer spherical shells of the two proteins are shown. Residues in the 5 Å slab are not considered in the calculation of fouter-shell-loops.