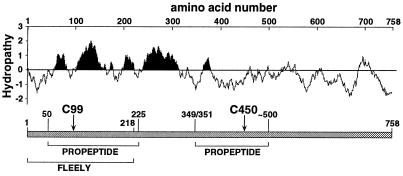
Figure 3.
Functional mapping of the carboxylase. A linear representation of the human carboxylase is shown, along with the two active site Cys residues identified in these studies, and regions that cross link to FLEELY or propeptide, identified in previous biochemical mapping studies (9–11). A hydropathy plot also is shown. Analysis was performed at bioinformatics.weizmann.ac.il/hydroph/plot_hydroph.html, using the Kyte-Doolittle x-1 method of calculating hydrophilicty over a window length of 25 to predict membrane spanning regions. The black shading highlights very hydrophobic regions of the carboxylase.

