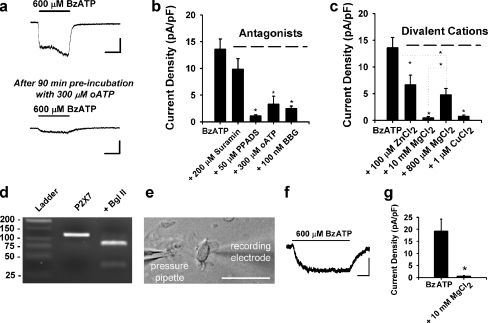
Fig. 2.
Ependymal cells express functional P2X7 receptors. a Response to BzATP application is reduced after 90-min pre-incubation with 300 μM oATP (data from separate cells; bars = 100 pA, 5 s). b Summary histogram showing antagonist effects on 600 μM BzATP-induced currents. Consistent with P2X7 responses in other studies, BzATP-induced currents (13.6 ± 1.9 pA/pF; n = 10) were not significantly blocked by 200 μM suramin (9.9 ± 2.0 pA/pF; n = 10, p = 0.19), but were significantly attenuated by 50 μM PPADS (1.1 ± 0.2 pA/pF; n = 9), 300 μM oATP (3.3 ± 1.5 pA/pF; n = 11), and 100 nM BBG (2.5 ± 0.5 pA/pF; n = 10). c Summary histogram demonstrating reduction of BzATP-induced currents by 100 μM Zn2+ (6.7 ± 1.8 pA/pF; n = 9), 10 mM Mg2+ (0.5 ± 0.3 pA/pF; n = 12), 800 μM Mg2+ (4.8 ± 1.2 pA/pF; n = 5), and 1 μM Cu2+ (0.7 ± 0.3 pA/pF; n = 10). d Agarose gel electrophoresis demonstrating RT-PCR amplification of P2X7 mRNA isolated during pipette aspiration of cytoplasm from ten ependymal cells directly lining the SVZ. Product of 119 bp was identified. The restriction endonuclease BglII (AGATCT) cleaved the amplified product to the predicted sizes of 82 and 37 bp. P2X7 was not detected in bath or water controls and bands corresponding to genomic P2X7 (1,588 bp) were never observed. e DIC image of an acutely dissociated ependymal cell during whole-cell patch clamp recording. Cells were identified based on the presence of moving cilia (bar = 25 μm). f Representative trace showing an inward current induced by 600 μM BzATP in this acutely dissociated cell (bar = 200 pA, 2 s). g Summary histogram showing the average current density of BzATP-induced responses in acutely dissociated cells (19.3 ± 5.0 pA/pF; n = 5) and in the presence of 10 mM Mg2+ (0.6 ± 0.3 pA/pF; n = 4). *p < 0.05 for panels b, c, and g)

