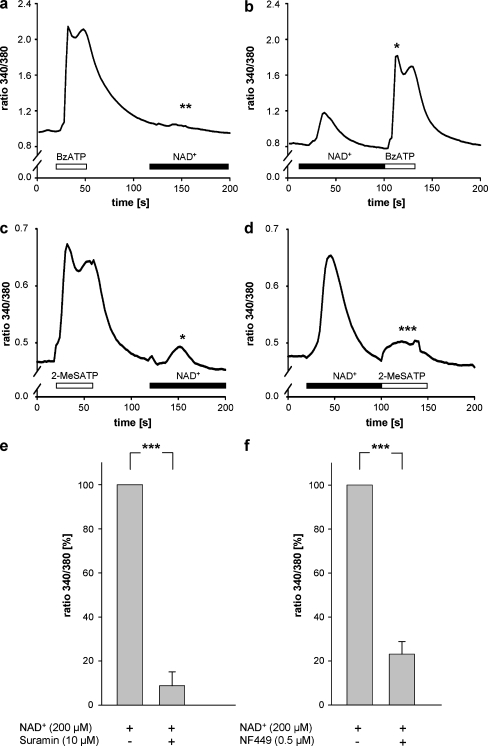
Fig. 3.
Engagement of P2X1 receptors. Monocytes were treated with 100 μM BzATP (open bar) before the addition of 200 μM NAD+ (black bar; a) or with 200 μM NAD+ (black bar) before the addition of 100 μM BzATP (open bar; b). Shown is the 340 nm/380 nm emission ratio from one representative measurement. **P < 0.01 (Student’s t test) Δ ratio 340/380 NAD+ (a) versus NAD+ (b; n = 3); *P < 0.05 (Student’s t test) Δ ratio 340/380 BzATP (a) versus BzATP (b; n = 3). Monocytes were treated with 100 μM 2-MeSATP (open bar) before the addition of 200 μM NAD+ (black bar; c) or with 200 μM NAD+ (black bar) before the addition of 100 μM 2-MeSATP (open bar; d). Shown is the 340 nm/380 nm emission ratio from one representative measurement. *P < 0.05 (Mann–Whitney rank sum test) Δ ratio 340/380 NAD+ (a) versus NAD+ (b; n = 3); ***P < 0.001 (Student’s t test) Δ ratio 340/380 2-MeSATP (a) versus 2-MeSATP (b; n = 3). Monocytes were preincubated with suramin (10 μM) for 25 min and continuously perfused with suramin during the addition of NAD+ (200 μM, 80 s; e). Intracellular Ca2+ levels were measured as the change in the 340 nm/380 nm emission ratio. Values obtained in the presence of NAD+ were set as the 100% reference. Results are means ± SEM of three measurements. ***P < 0.001 (Student’s t test). Monocytes were preincubated with NF449 (0.5 μM) for 25 min and continuously perfused with NF449 during the addition of NAD+ (200 μM, 80 s; f). Intracellular Ca2+ levels were measured as the change in the 340 nm/380 nm emission ratio. Values obtained in the presence of NAD+ were set as the 100% reference. Results are means ± SEM of three experiments. ***P < 0.001 (Student’s t test)

