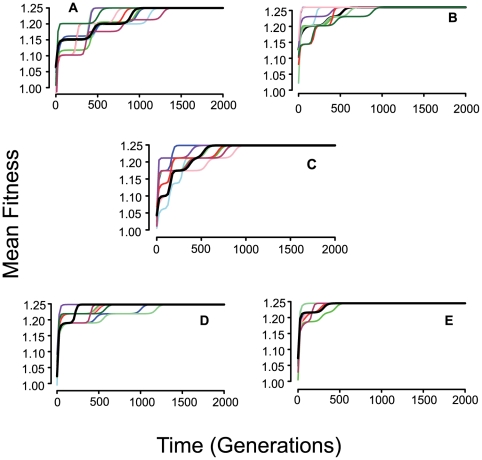
Figure 4. Increase in mean fitness for 10 independent runs with random start of nc = 10 or 50 clones.
In all cases, c = 0.5, e = 1, μ = 10−8, N = 108. (A) c = 0, nc = 10 (B) c = 10−15 nc = 10, (C) χ = 10−14, nc = 10, (D) χ = 0, nc = 50, (e) χ = 10−15, nc = 50. The thick dark line is the mean fitness of all 10 runs.

