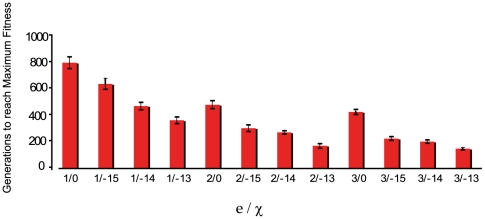
Figure 6. The contribution of intensity and form of the fitness function on the extent to which mutation and recombination augment rates of adaptive evolution; mean and standard error of the time before the population reaches its maximum value  for different values of the exponent e, and recombination rate parameter (χ).
For the latter −15 is χ = 10−15 and −14 is χ = 10−14. In all simulations, μ = 10−8, NT = 108, c = 0.5. Each simulation was initiated with 10 randomly chosen genotypes and 50 independent simulations were run with each set of parameters.

