
Figure 6.
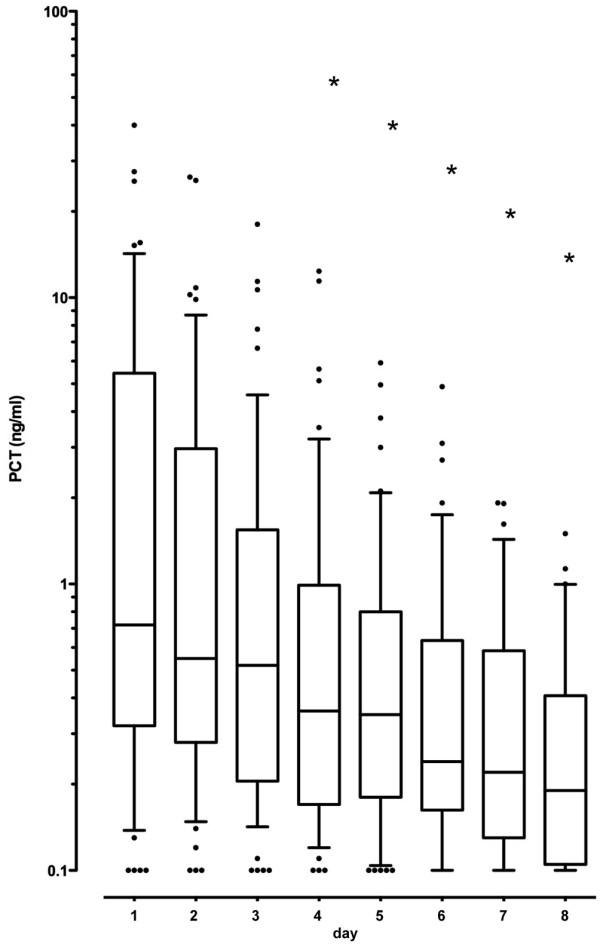
Procalcitonin levels solely shown for the intervention arm. In the group with procalcitonin (PCT)-guided antibiotic therapy duration, the PCT values starting on the fourth day are significantly lower in comparison to the initial value (box-plots with lower quartile, median and upper quartile, 0.1- and 0.9-quantile for the whisker length and outliers as item representation). • = Outliers, *P < 0.05.