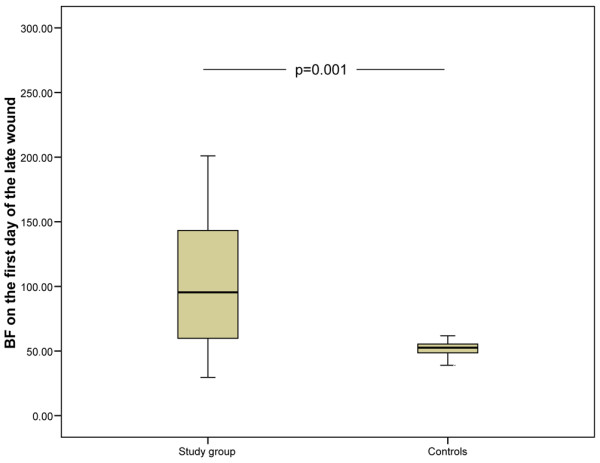
Figure 3.

Skin blood flow on the first day of the late wound. A significant difference was found between the study group and the control group. The lower and upper edges of each box indicate the interval between the 25th and 75th percentiles. The vertical line represents the range and the horizontal line within the box represents the median of each group. BF, blood flow.
