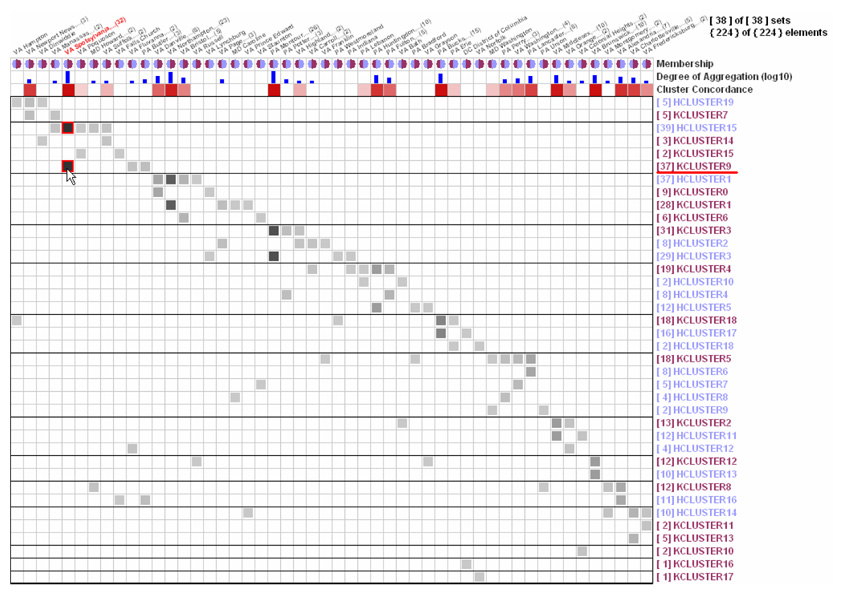
Figure 11.
Clustering Results Comparison (HCLUSTER: Hierarchical Clustering, KCLUSTER: K-means Clustering) with Census data of 224 US eastern counties in or near Maryland. These two clustering results are not very consistent with each other. Gray cells deviating from the diagonal line with corresponding empty cells in the Cluster Concordance row are the ones that differentiate the two clustering results.

