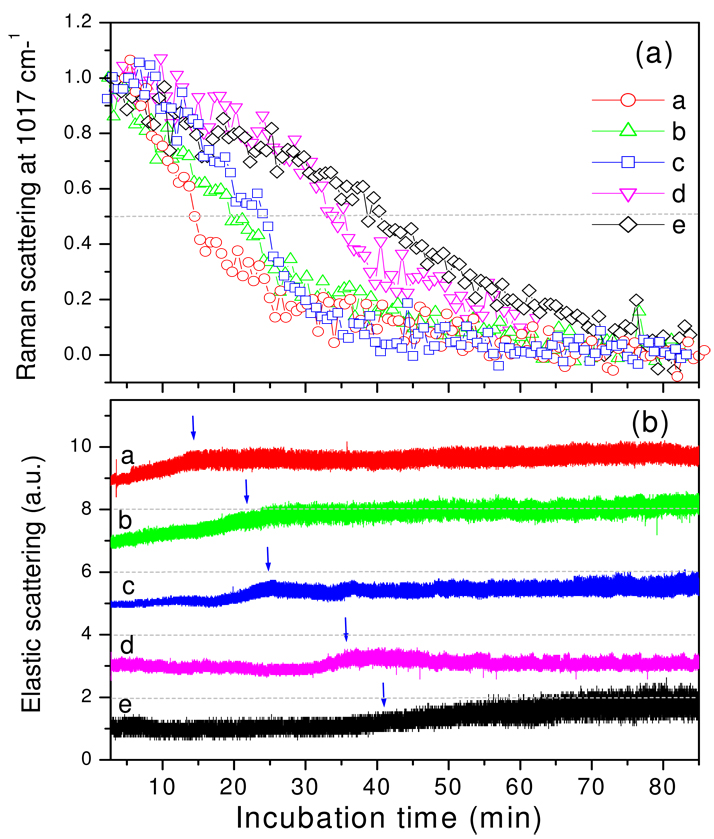
Figure 4.
Figure 4a,b. CaDPA release and ESLI from B. subtilis spores that cannot degrade their cortex during L-alanine germination. a) The relative intensities of the 1017-cm−1 CaDPA band from five B. subtilis FB113 (cwlJ sleB) spores that do not degrade their cortex during germination with L-alanine were determined as described in Methods. b) The ESLI from the five spores germinating in a) were determined as described in Methods. These latter values were normalized to values obtained in the first measurement, and normalized values were shifted by 2 on the y-axis for display purposes. The dashed lines at 2, 4, 6 and 8 are the levels of zero ESLI for spores d, c, b and a, respectively, and the vertical blue arrows indicate the time at which the DPA level of individual spores was reduced by 50%.

