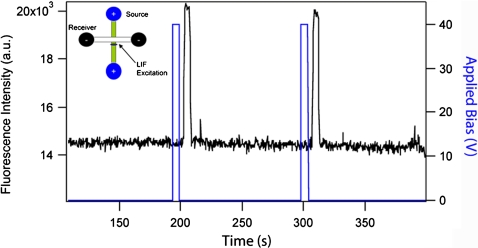
Figure 3.
Illustration of sample stacking. Fluorescence signal (black) monitored in the source channel as a function of time and applied bias (red). (Inset) LIF signal acquisition geometry. LIF is monitored ∼1 mm away from the microchannel cross-section in a channel prepared with 1 μM fluorescein in 10 mM pH 9 phosphate buffer.

