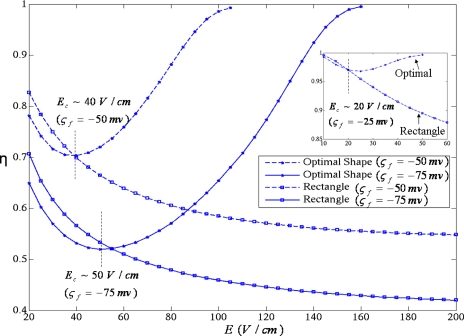
Figure 10.
Mixing index behavior with respect to electric field for ςf=−50 mV and ςf=−75 mV. Mixing index decreases monotonically for rectangular shape, whereas mixing performance increases after critical field strength Ec for near right triangle (optimal) shape. (Inset plot data corresponds to ςf=−25 mV.)

