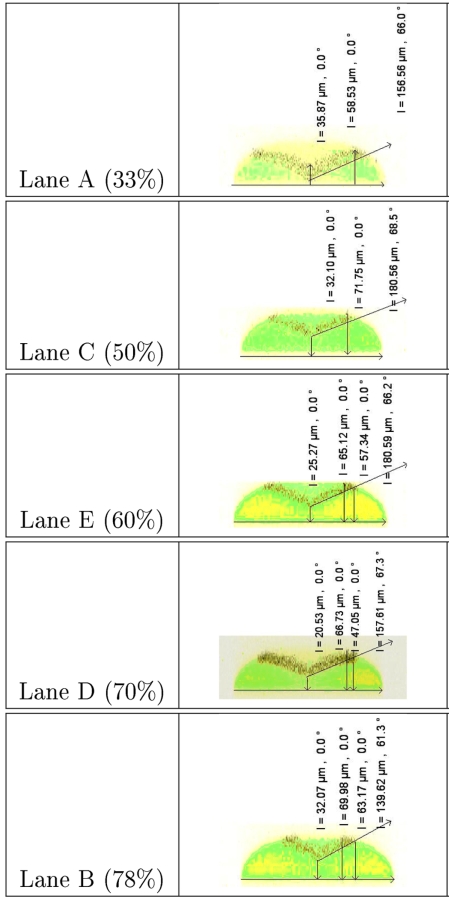
Figure 5.
Confocal microscope images of the test device (configurations A–D, Fig. 2) taken after three additive junctions [S1–S3, at plane V3 Fig. 1b] and organized according to a relative contribution from the third junction (S3). The yellow∕green areas map the region of fluorescence from fluorescein dye doped into the buffer flows (yellow∕green colors reflect slight intensity differences). The dark layer includes nonfluorescent beads that displace the buffer and appear black. The middle analysis layer (black) takes on a gull-wing profile, sandwiched between two layers of sheath. The percentage of total analysis-channel flow contributed by S3 is indicated as a percentage in the right column of the figure. The black text in the image panels is produced in the image analysis software; black vectors are indicated in length (μm) and angle from vertical (degrees). As indicated, the slope on the analytic layer is typically 61°–68° from vertical (20°–30° off horizontal). Exit-port flow rate is 400 μL∕h.

