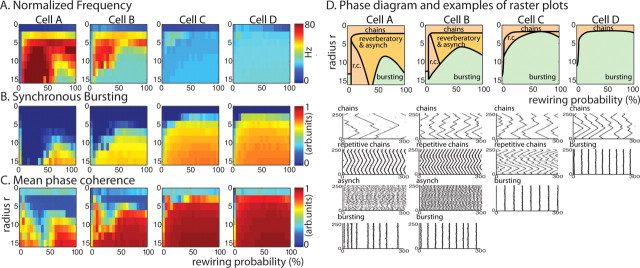
Figure 3.
Spatiotemporal pattern formation in 250 cell excitatory networks with homogeneous cell type as described by our three measures; average frequency F (A), bursting B (B), and mean phase coherence R (C) for network topologies with rewiring parameter p between 0 and 100% (horizontal axis) and radius of connectivity r between 0 and 16 (vertical axis) for all four cell types (columns cell A to cell D). Warm colors denote high values and cool colors denote low values. D, E, Summary plots showing network activity patterns obtained in different regions of rewiring p and connectivity r parameter space as derived from our three measures for networks consisting of each cell type (top row, columns cell A to cell D). Raster plots showing 300 ms of network activity in each parameter region of summary plots (bottom rows, columns cell A to cell D). In the raster plots, we have removed the initial 100 ms of network activity to ignore initialization transients.

