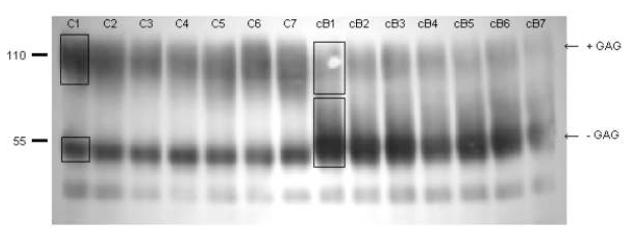
Figure 2.
Western blot for decorin in 7 sections from top layer of control and cB treated cartilage from the indentation tests. Numbers after C and cB refer to sections shown in Figure 3. Arrows indicate decorin with (+GAG) and without (-GAG) dermatan sulfate attached. Boxes indicate the regions evaluated by densitometry.

