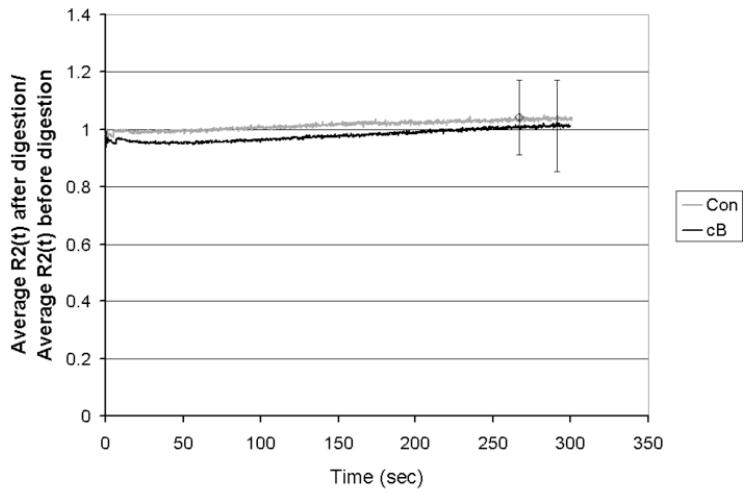
Figure 6.
Average relaxation function for the tension tests for the second step, R2(t), after digestion divided by R2(t) before digestion, for control specimens (CONS/S; N = 3) and specimens treated with cB (cBS,M/S,M; N = 7). There was no statistically significant difference from one in either average curve due to the incubation and CON is not different from cB at any time point.

