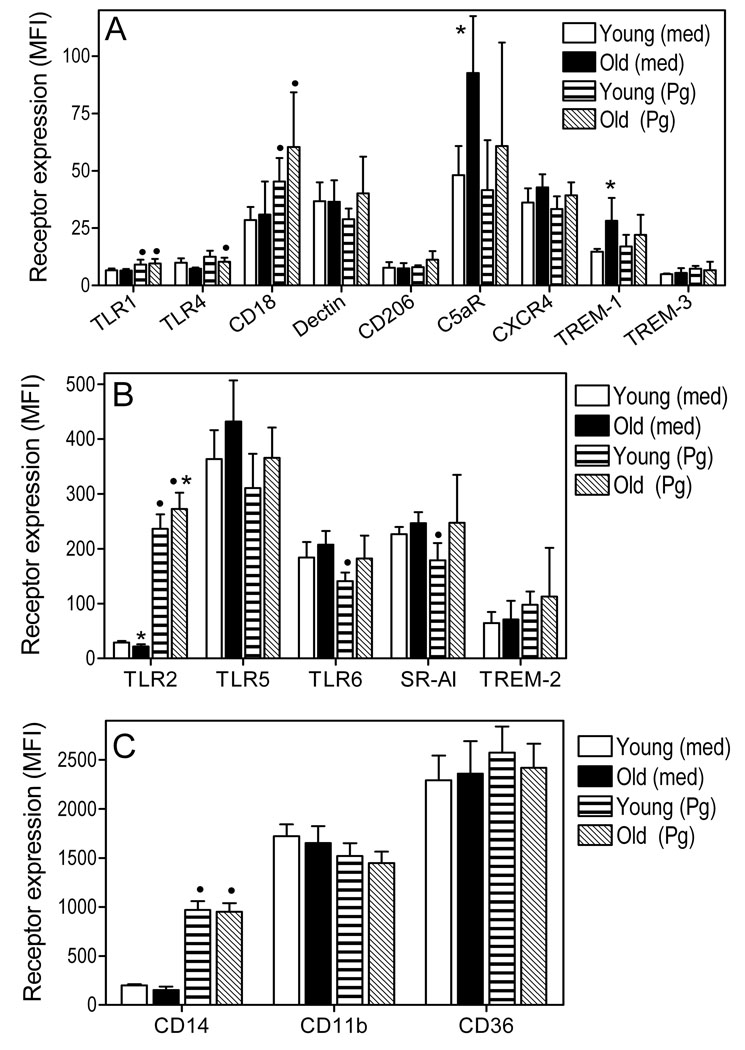
Fig. 3. Flow cytometric expression analysis of selected innate immune receptors in young and aged macrophages.
Freshly explanted peritoneal macrophages from young or old mice were stimulated with P. gingivalis (Pg; MOI = 10:1) or medium (med) control for 18h. The expression levels of the indicated receptors was determined by flow cytometry after cell staining with appropriate fluorescently labeled antibodies, and results are shown as mean fluorescent intensity (MFI). The data were assigned to three panels (A–C) according to receptor expression level (A, low; B, medium; and C, high) to facilitate visualization of differences. Each data point represents the mean (with SD) of 5 to 10 separate MFI values corresponding to flow cytometric analysis of macrophages from individual mice. Asterisks indicate statistically significant (p < 0.05) differences between “old” and “young” macrophages, within the same activation status. Black circles show statistically significant (p < 0.05) differences compared to unstimulated macrophages, within the same age group.

