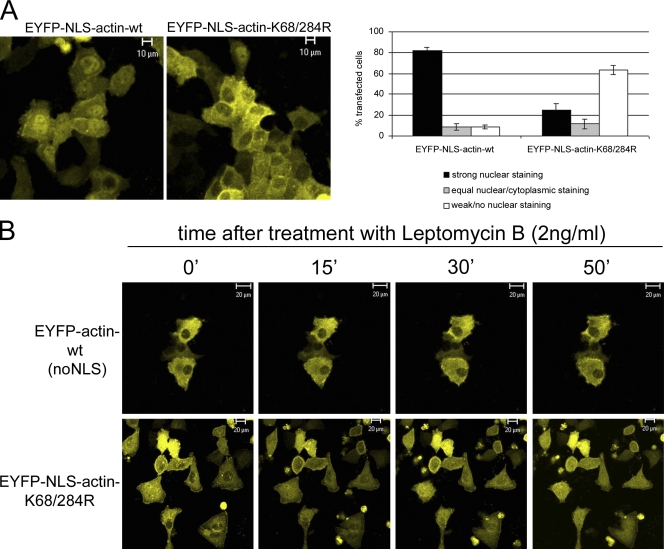
Figure 4.
Localization of EYFP-actin in live cells. (A) Distribution of EYFP-NLS-actin-wt and EYFP-NLS-actin-K68/284R. Confocal images of live cells taken 20 h after transfection (left). The distribution of the two proteins was quantified in 100 transfected cells per experiment (error bars indicate mean ± SEM, n = 3). (B) Time course of cellular localization of EYFP-actin-wt and EYFP-NLS-actin-K68/284R after leptomycin B treatment (2 ng/ml).

