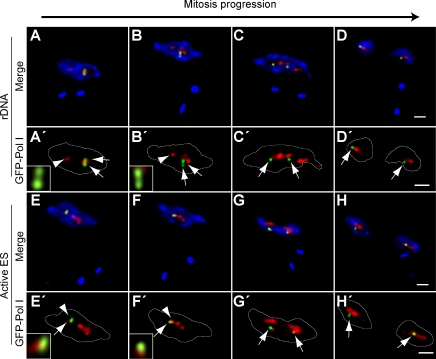
Figure 3.
Sisters of the active VSG ES remain associated to the unique ESB until chromosome segregation. Different cell lines with a GFP tag in either the rDNA locus or the active VSG ES were subjected to double indirect 3D IF using anti-TbRPA1 antiserum, monoclonal anti-GFP antibodies, and DAPI staining. The positions of GFP dots and pol I machinery were determined during different mitotic phases as defined by DAPI staining (Fig. S2). (A–H) Maximum intensity projections of three-channel 3D representative stacks showing anti-TbRPA1 signal in red, anti-GFP signal in green, and DAPI staining in blue in the cell line GFP tagged in the rDNA (A–D) or active VSG ES (E–H). (A′–H′) Maximum intensity projections of the anti-TbRPA1 and anti-GFP signals. Insets show single planes of anti-TbRPA1 and anti-GFP signals for the slice in which the maximum GFP dot intensity was detected. The yellow color indicates colocalization. White lines indicate the nuclear outline. Arrows indicate the GFP dot signal, whereas arrowheads mark the position of the ESB. Bars, 1 µm.

