Figure 4.
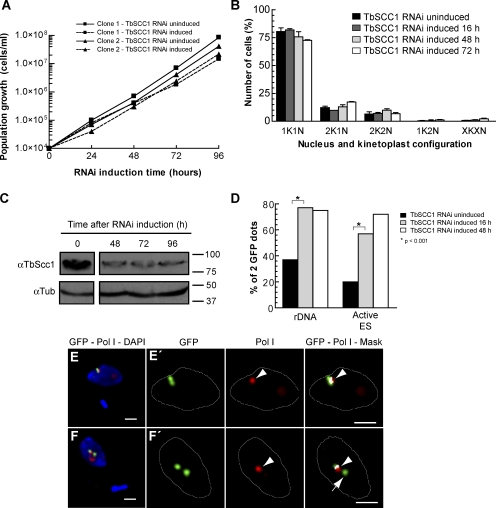
Knockdown of TbSCC1 results in a decrease in sister chromatid cohesion in the active VSG ES and loss of association with the ESB. Bloodstream form cell lines that contain a tetracycline-inducible partial knockdown of the cohesin subunit TbSCC1 were selected and characterized. (A) Growth curves of two independent clones in which RNAi of TbSCC1 has been induced (doxycycline+) compared with uninduced cultures (doxycycline−). (B) Cell cycle progression as revealed by quantification of nucleus and kinetoplast configurations after different induction times of TbSCC1 knockdown. Mean ± SD of the percentages (n > 300 for each time point) obtained for two independent clones are shown. (C) Western blot using anti-TbSCC1 antiserum (Sharma et al., 2008) showing a partial depletion of the levels of the TbSCC1 protein after different periods of induction of TbSCC1 RNAi. Molecular mass is indicated in kilodaltons. (D) GFP-tagged cells lines were subject to indirect IF using anti-GFP antibodies as well as DAPI staining and were recorded as displaying one or two GFP dots in 2K1N cells. The histogram shows the percentages of cells displaying two GFP dots corresponding to duplicated and separated sister chromatids of either the active VSG ES or the rDNA locus at different time points after induction of TbSCC1 knockdown (rDNA: uninduced [n = 115], induced 16 h [n = 110], and induced 48 h [n = 103]; active VSG ES: uninduced [n = 112], induced 16 h [n = 107], and induced 48 h [n = 104]). (E and F) A cell line with a GFP tag in the active VSG ES was subjected to double indirect 3D IF using anti-TbRPA1 antiserum, monoclonal anti-GFP antibodies, and DAPI staining upon 4 d of induction of TbSCC1 down-regulation. Maximum intensity projections of three-channel 3D representative stacks showing anti-TbRPA1 signal in red, anti-GFP signal in green, and DAPI staining in blue in 1K1N cells. (E′ and F′) Colocalization analysis of the GFP dot signals with respect to the ESB. Maximum intensity projections of the subset of slices containing GFP dot signal are shown. A colocalization mask (white) was calculated for each nonequalized 8-byte slice and merged with both anti-GFP (green) and anti-TbRPA1 (red) labeling. Arrowheads indicate the position of the ESB, whereas the arrow marks a sister chromatid of the active VSG ES that is no longer associated with the ESB. White lines indicate the nuclear outline. Bars, 1 µm.

