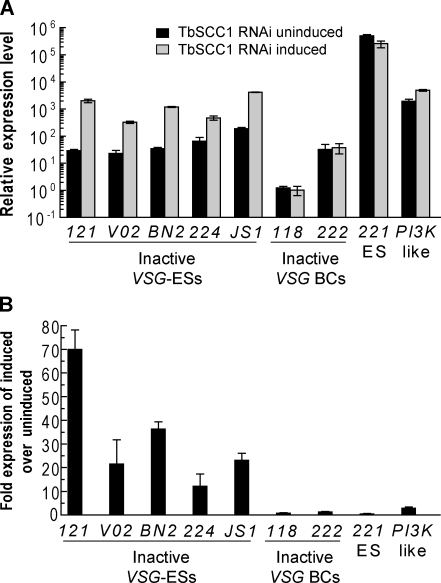
Figure 6.
Knockdown of TbSCC1 results in the in situ transcriptional activation of inactive telomeric VSG ESs. (A) Histogram showing the relative expression of mRNA measured by qRT-PCR of VSG genes located in different VSG ESs (ES) or different promoter-lacking VSG BC genes upon 4 d of induction of TbSCC1 RNAi. An increase in the expression of VSG genes located in previously inactive VSG ESs is detected, whereas VSG-BCs remain at a similar level when compared with the uninduced control. Expression values are plotted in relative expression units, calculated relative to myosin expression, and multiplied by 1,000 for better visualization on a logarithmic scale. (B) Histogram showing the fold change in gene expression levels (TbSCC1 RNAi induced/TbSCC1 RNAi uninduced) shown in A. (A and B) Mean ± SD of three different measures is shown.

