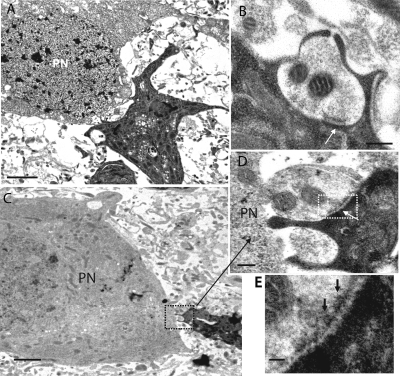
Figure 2.
Ultrastructural evidence for synaptic junctions between CoH and NG2 glia. (A) Biocytin-labeled NG2 glia (dark profile) in close vicinity to a principal neuron (PN). (B) Example of a synaptic-like junction (arrow) between a finger of a CoH and a process of a biocytin-labeled NG2 glia as shown in A. (C) A labeled process of an NG2 glia is in contact with the CoH. (D) Higher magnification of the area delineated by the dashed rectangle in C shows a synaptic junction (arrow). Presynaptic areas contain small clear vesicles. (E) Consecutive section at higher magnification (the area in dashed rectangle in D; vesicles appear as docked to the presynaptic membrane [arrows]). Note a cleft-like structure that contains electron opaque material. (C–E) Obtained from the same NG2 glia. Bars: A and C, 2 μm; B and D, 0.2 μm; E, 0.1 μm.

