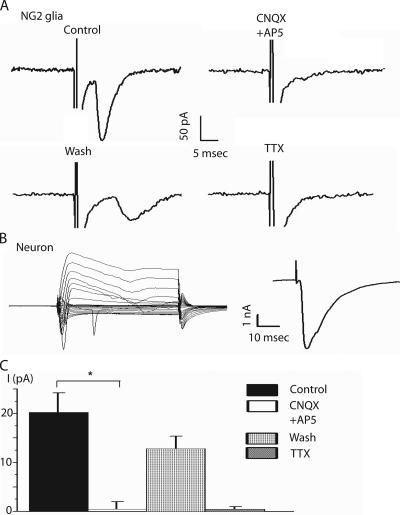
Figure 3.
Evoked PSCs in NG2 glia and neurons. (A) Example traces showing responses of NG2 glia evoked by midline stimulation (stimulus intensity, 100 μA). (Top left row) Control conditions. (Top right row) The application of 20 μM CNQX and 50 μM AP5 to block AMPA-KAR and NMDAR, respectively. Reversibility inhibited the postsynaptic current. (Bottom left row) After 10 min of wash, the postsynaptic current partially recovered in the NG2 glia. (Bottom right row) 1 μM TTX abolished the current response. (B; Left) Current response from a principal neuron evoked by step voltages (50 ms; 10-mV increments) from −160 to +40 mV from a holding potential of −70 mV. (Right) Current response of the principal neuron shown on the left to midline stimulation with 100 μA (as applied to NG2 glia). (C) Summary of current responses to midline stimulation corresponding to the four experiments shown in A (n = 7). Data are the mean ± SEM. Asterisk represents significant difference (*, P = 0.02).

