Figure 6.
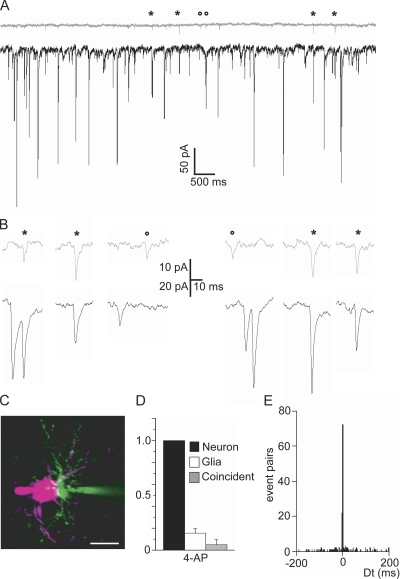
Coincident spontaneous synaptic activity recorded in NG2 glia and neurons. (A) Double whole cell recording showing the sPSCs in a principal neuron (black) and a closely apposed NG2 glia (gray) elicited by 100 μM 4-AP. The asterisks mark examples of coincident events, whereas the circles indicate examples of noncoincident events. Note the frequency difference in neuron and NG2 glia. (B) Representative sPSCs marked in A with higher time resolution. (C) Two-photon laser scanning microscope image of a recorded cell pair showing the neuron in magenta and the NG2 glia in green (filled with Alexa 594 and LY, respectively, through the patch pipette). Bar, 10 μm. (D) Summary of events in neurons, glial cells, and coincident events. The number of events was normalized to the number of events recorded in the neurons (n = 9). Data are the mean ± SD. (E) Time-difference histogram of events in glial cells related to neurons. The time difference between events in the two cells is plotted as a histogram with a bin width of 1.0 ms. Note the sharp peak around 0 ms.

