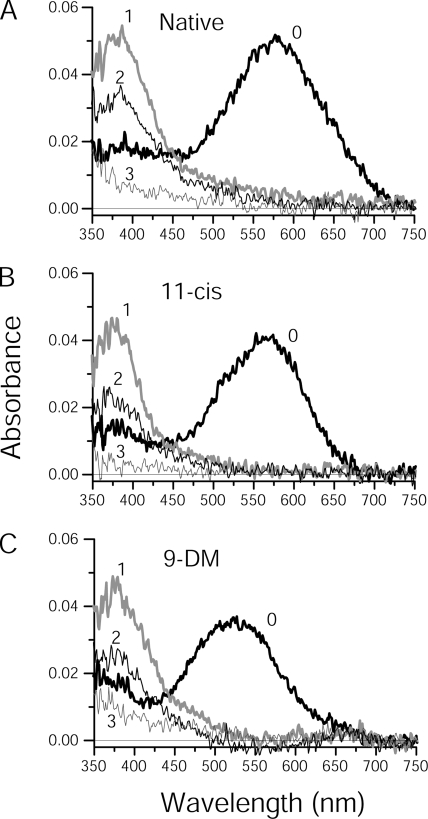
Figure 2.
Series of post-bleach spectra of Ambystoma mexicanum red cones containing different visual pigment chromophores. Spectra were recorded at two polarizations (only T-polarizations are shown) and averaged from native red cones (A; n = 11), or red cones regenerated with either 11-cis retinal (B; n = 11) or 9-DM retinal (C; n = 9). After recording the dark spectra (curves labeled 0 in each case), a 1-s 525-nm flash was applied and post-bleach spectra were recorded immediately after the bleach (curves labeled 1 in each case) and at various time increments thereafter. Curves 2 represent recordings at either 5 s (A and B) or at 30 s (C) post-bleach and illustrate the approximate half-maximum MI + MII absorbance (peak at 380 nm). Curves 3 were recorded at 600 s post-bleach in all cases. Intermediate spectra recorded at 10, 20, 60, 100, 200, and 300 s post-bleach are excluded to avoid clutter.

