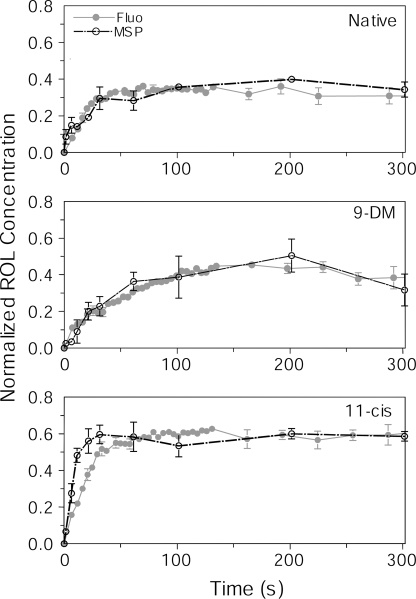
Figure 5.
A comparison of time courses of ROL production derived from microspectrophotometry versus microfluorometry. Data from Figs. 3 (bottom) and 4 have been replotted on the same graph for comparison. Data obtained by microspectrophotometry (MSP) are shown in black: n = 11 cells (native), 9 cells (9-DM), and 11 cells (11-cis). Fluorescence data are shown in gray: n = 6 cells (native), 6 cells (9-DM), and 5 cells (11-cis). Concentration of ROL in microspectrophotometry data are expressed as a fraction of bleached cone pigment. Fluorescence data are scaled for best visual match to microspectrophotometry. Error bars show ± SEM.

