
Figure 1. RORα has a systematic effect on developmental RNA expression profile in cerebellum.
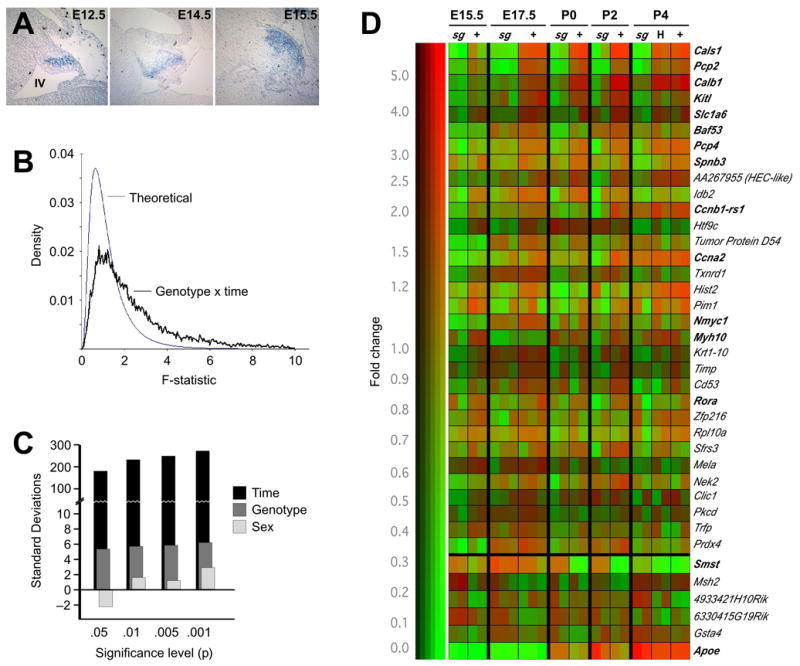
(A) In situ hybridization shows expression of Rora RNA in developing Purkinje cells as early as E12.5 and expressing cell populate the presumptive cortex by E15.5. Caudal is clockwise from top, position of the fourth ventricle is indicated in the first panel.
(B) Distribution of F statistics generated by standard two-factor ANOVA indicate significant effects of genotype and time (but not gender) in our multidimensional data set compared to the distribution generated under the null hypothesis of no effect.
(C) The number of standard deviations by which the data depart from expectation is plotted. The number of probe sets reaching given significance levels (p-values) for effect of time, Rora genotype, or gender is compared to the distribution of numbers expected by chance under the null hypothesis.
(D) Clustergram of genes identified in our analysis indicates the strength of genotype dependence and that the majority of differentially expressed genes do not have a strong heterozygote effect. Color indicates relative expression level among experiments and brightness indicates absolute signal strength. Probe sets with a p-value less than 0.05 for genotype effect by ANOVA, a minimum average difference of 500 according to MAS and a minimum 1.25-fold change are shown. Genes are arranged in order by the product of F-statistic for genotype and approximate fold change. For upregulated genes, only those with consistent patterns across the full perinatal window are shown.