
Figure 3. RORα regulates candidate mitogenic factors in Purkinje cells.
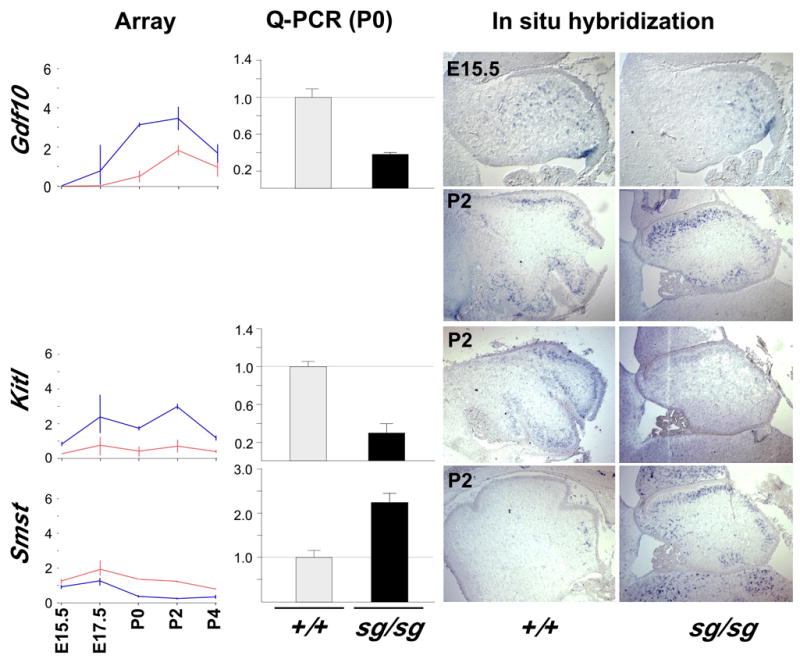
Line plots of normalized array data from Kitl, Smst, and Gdf10. Q-PCR confirms reduced expression of Gdf10, but increased expression of Smst RNA in staggerer by P0. Difference by genotype has a p-value ≤0.02 for Gdf10 and p≤0.0023 for Smst by 2-sided t-test. In situ hybridization at postnatal day 2 (as well as E15.5 for Gdf10) indicates the relevant cell population and qualitatively confirms altered expression level for Kitl, Smst, and Gdf10, including dramatic increase in Smst-positive cells by P2. Although Gdf10 expression is roughly in the Purkinje cell layer at P2, expression at E15.5 is not consistent with Purkinje cells (compare with Pcp4 pattern in Figure 6), suggesting expression in Bergmann glia or inhibitory interneurons.