
Figure 2. Quantitative RT-PCR validation of miRNA expression.
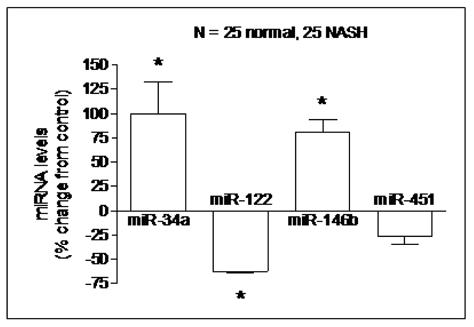
The relative abundance of four specific miRNAs (25 NASH vs. 25 controls) was measured using RT-PCR and expressed as mean % change ± S.E.M. after normalization to GAPDH. miR-34a and miR-146b were confirmed to be overexpressed by 99% and 80% respectively while miR-122 was confirmed to be underexpressed by 63% (p< 0.02 for all). The expression of miR-451, which was not differentially expressed by microarray, was confirmed not to be significantly different between the two groups.