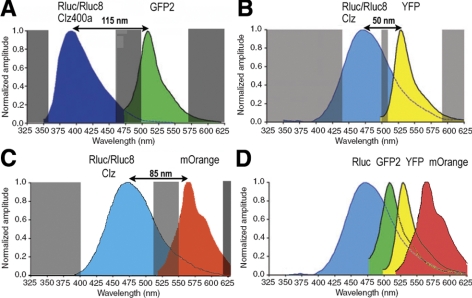
Figure 1.
Schematic diagrams showing imaging schemes of various BRET systems, highlighting the spectral resolution achieved in each case. A) Spectral spans of donor and acceptor imaging windows (clear areas) for BRET2/modified BRET2 using RLuc8 as donor. Note that overlap between donor and acceptor light is minimal. Shaded areas indicate wavelength of light being blocked by spectral filters used for imaging instrument. B) Typical spectral spans of donor and acceptor imaging windows in the case of BRET1/modified BRET1. Donor signal significantly contaminates acceptor signal. C) Spectral spans of imaging windows to measure donor and acceptor light in the case of BRET3. Donor spectrum is same as in BRET1, and red-shifted mOrange acceptor signal improves spectral resolution to 85 nm, thereby reducing donor bleedthrough in acceptor window. D) Schematic showing various control BRET-based fusion proteins using RLuc8 reporter BRET3 provides most appropriate emission wavelengths for animal imaging due to its emission wavelength peak at 564 nm.

