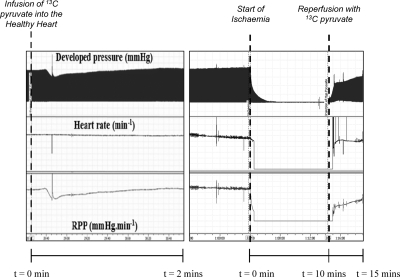
Figure 1.
A representative recording of cardiac function throughout the perfusion protocol, showing developed pressure, heart rate and rate pressure product. Left panel: effects of hyperpolarized pyruvate infusion during the first 2 min of MR data acquisition. Right panel: ischemia and 5 min of postischemic recovery.

