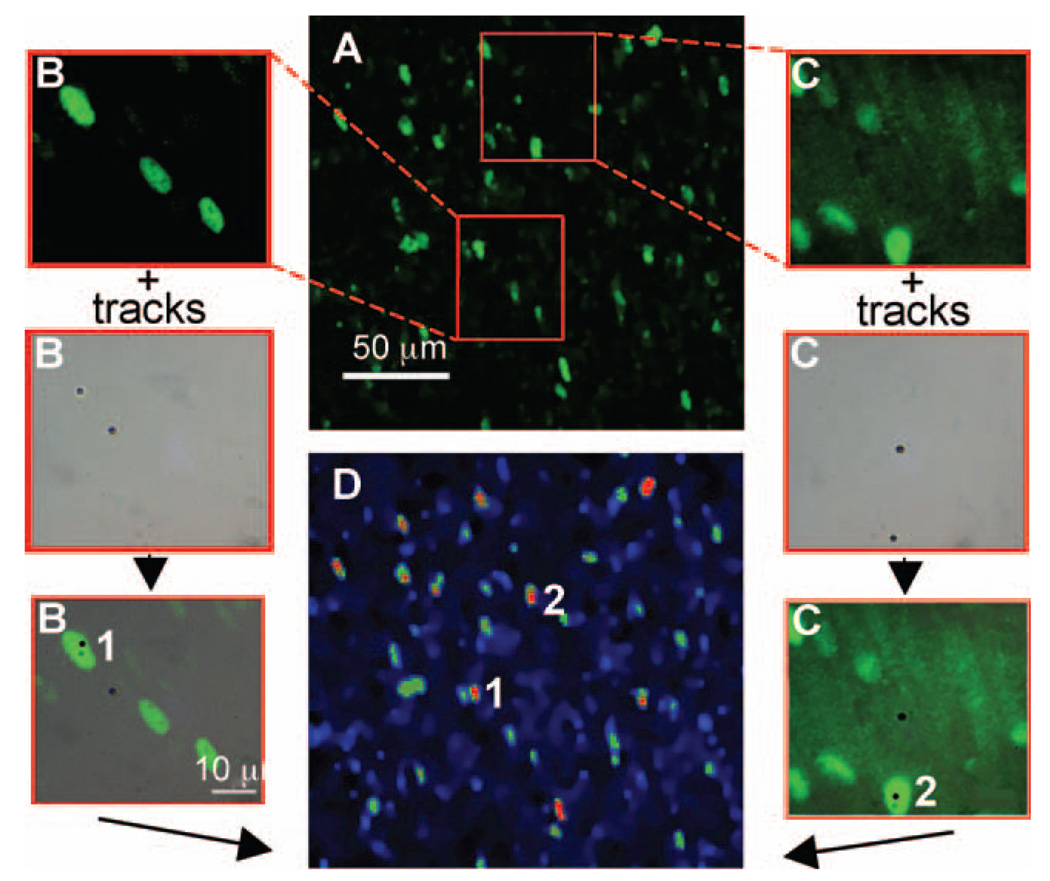
FIG. 2.
Correlation of the extent of p21Waf1 induction with the number of α-particle track traversals. Confluent AG1522 fibroblast cultures grown on PET-CR-39 dishes were exposed to 0.13 cGy, incubated for 3 h at 37°C, and fixed with paraformaldehyde, and the CR-39 was etched in KOH. Panel A: Typical in situ immunofluorescence representation of p21Waf1 up-regulation occurring in cell aggregates (original magnification 20×). Panels B and C: Illustration of the procedure used to locate irradiated nuclei or signal-emitting cells (numbered 1 and 2) within a cluster of responding cells. Panel D: False color illustration of p21Waf1 overexpression scaled as a function of fluorescence intensity (from blue color for lower intensities to red color for higher intensity).

