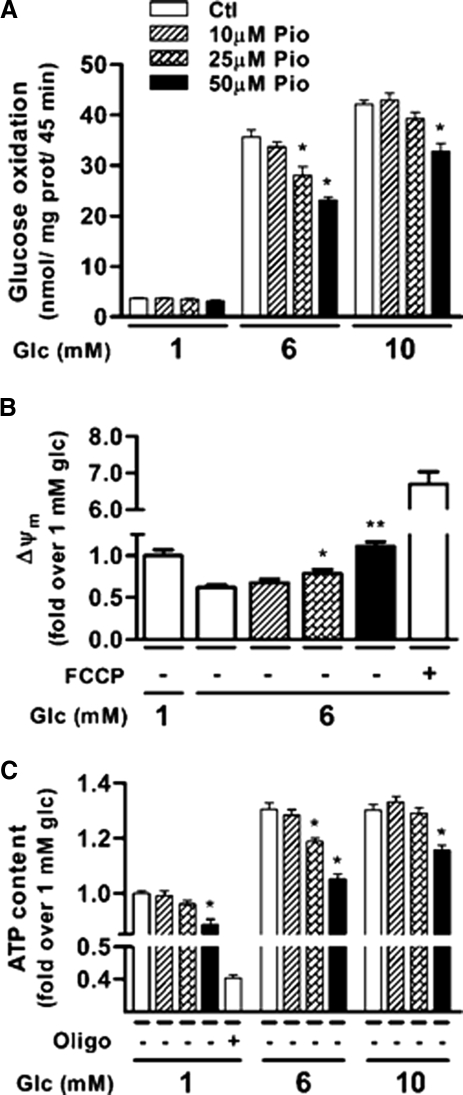
Figure 2.
Pio reduces glucose oxidation, the mitochondrial membrane potential and ATP content of INS 832/13 cells. A, Glucose oxidation measured after 45 min using d-[U-14C]glucose. Means ± sem, n = 9 (nine different cell wells in three separate experiments), except 25 μm Pio where n = 6 (two separate experiments). Two-way ANOVA post hoc analyses: *, P < 0.001 vs. vehicle at same glucose concentration. B, Δψm measured with rhodamine 123 after 10 min incubation. Data are expressed as changes in rhodamine 123 fluorescence vs. changes measured in presence of 1 mm glucose plus DMSO. Means ± sem, n = 18 (18 different cell wells in three separate experiments). One-way ANOVA post hoc analyses: *, P < 0.05; **, P < 0.001 vs. vehicle at 6 mm glucose. FCCP, Carbonyl cyanide 4-(trifluoromethoxy)phenylhydrazone, 5 μm. C, Total ATP content measured after 10 min incubation. Data are expressed as fold change over basal (1 mm glucose) control condition. Means ± sem, n = 3 (three experiments done with six replicates). Two-way ANOVA post hoc analyses: *, P < 0.001 vs. vehicle at same glucose concentration. Oligo, Oligomycin, 2 μm; Glc, glucose; Ctl, control; prot, protein.

