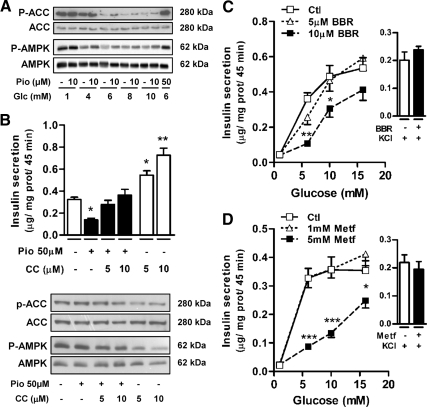
Figure 3.
Pio inhibitory effect on GIIS involves AMPK activation in INS 832/13 cells. A, Representative immunoblots for Pio-induced AMPKα (Thr172) and ACC (Ser79) phosphorylation after 20 min incubation. B, Graph, Insulin secretion from INS 832/13 cells incubated in the presence of 10 mm glucose with (black bars) or without (white bars) 50 μm Pio and the indicated compound C (CC) concentrations. Means ± sem, n = 16 (16 different cell wells in five separate experiments) except when compound C is used alone where n = 10 in three separate experiments. One-way ANOVA post hoc analyses: *, P < 0.01; **, P < 0.001 vs. vehicle. Immunoblots, AMPKα and ACC phosphorylation (P-AMPK and P-ACC) status in cells collected at the end of the incubations. C and D, Insulin secretion from INS 832/13 cells incubated in the presence of the indicated glucose concentrations and 0 (open squares), 5 (open triangles), or 10 μm berberine (BBR) (closed squares) (C) or 0 (open squares), 1 (open triangles), or 5 mm metformin (Metf) (closed squares) (D). Right to each graph, Insulin release induced by 1 mm glucose and 35 mm KCl with (black bars) or without (white bars) 10 μm BBR (C) or 5 mm Metf (D). Means ± sem, n = 9 (nine different cell wells in three separate experiments). Two-way ANOVA post hoc analyses: *, P < 0.05; **, P < 0.01; ***, P < 0.001 vs. vehicle at same glucose concentration. Glc, Glucose; Ctl, control; prot, protein.

