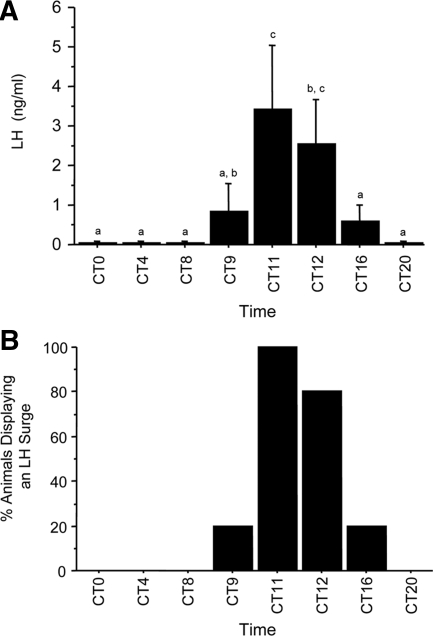
Figure 2.
A, Mean (±sem) serum levels of LH in OVX, E2-treated mice housed in constant conditions and killed at one of eight time points throughout the circadian day. Values with different letters differ significantly from each other (P < 0.05). B, Percentage of animals at each time point displaying an LH surge (defined as an 8-fold or greater increase in LH values compared with mean CT 0 and CT 4 values) (31). n = 4–6 animals per group.

