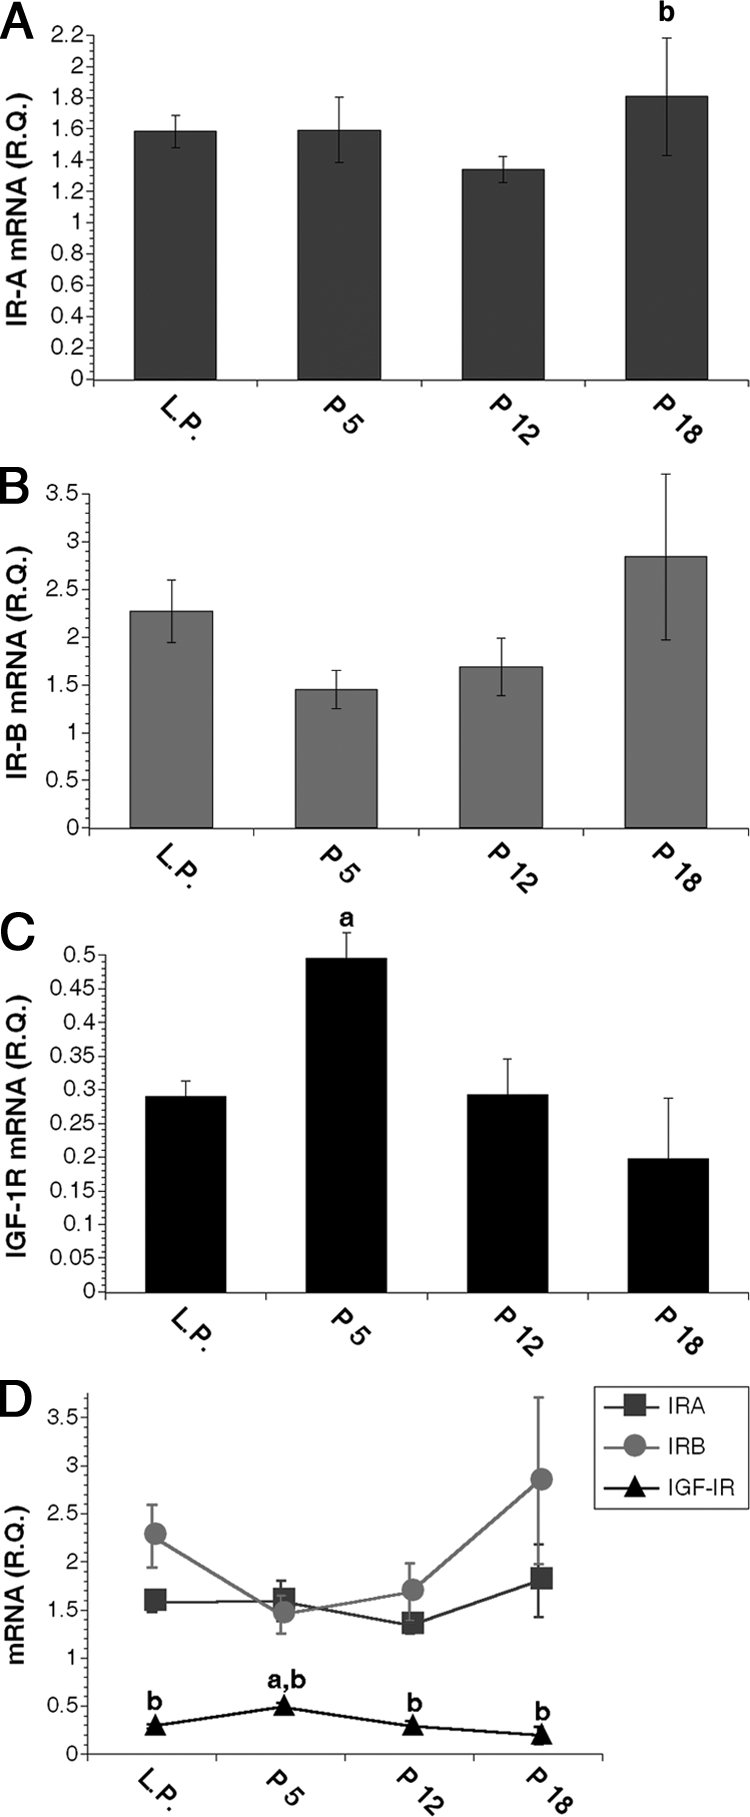
Figure 1.

IR isoform and IGF-1R mRNA expression in MECs during development. A–C, Relative quantity (R.Q.) of IR-A (A), IR-B (B), and IGF-1R (C) mRNA molecules in purified MEC samples as measured by Q-PCR after normalization to β-actin. D, Line graph combines data from A–C to demonstrate receptor mRNA expression levels relative to each other throughout MEC differentiation. a, P < 0.02 vs. IGF-IR at LP, P12, and P18; b, P ≤ 0.05 vs. P5 in A and vs. IR-A and IR-B in D. Data are expressed as mean ± sem; n = 5 for LP and P5; n = 4 for P12 and P18.
