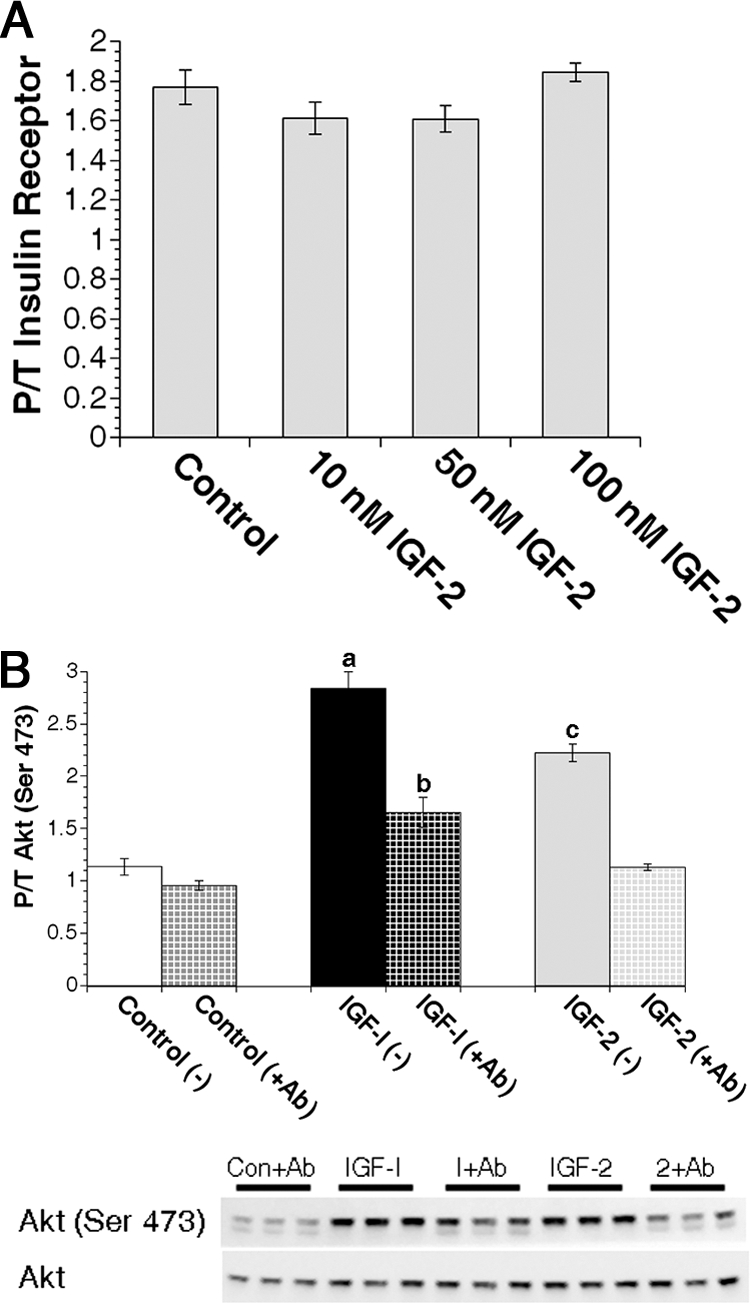
Figure 3.

IGF-II activates the IGF-1R but not the IR in primary MECs. A, Quantification of IR activation in virgin primary MEC samples treated with 0 nm (control) or 10, 50, or 100 nm IGF-II for 15 min immediately followed by protein isolation. Bars indicate mean ± sem units of phospho (pYpY1162/1163) IRβ subunit per nanogram total IRβ subunit protein. P/T, Phospho/total. B, Freshly isolated primary MECs from virgin animals were pretreated with or without 500 nm IGF-1R blocking antibody (Ab) A12 for 30 min followed by treatment with 0 nm (control), 50 nm IGF-I, or 50 nm IGF-II with or without blocking antibody for an additional 15 min. Graphs depict densitometric analysis of Akt Western immunoblot images. Solid bars (without blocking Ab) and checked bars (with blocking Ab) indicate mean ± sem of phosphorylated Akt (Ser473) adjusted to total Akt expression. a, P ≤ 0.001 vs. control (±Ab), IGF-I (+Ab), and IGF-II (±Ab); b, P < 0.004 vs. control (±Ab), and IGF-II (+Ab); c, P < 0.002 vs. control (±Ab), IGF-I (+Ab), and IGF-II (+Ab). n = 3 samples per treatment.
