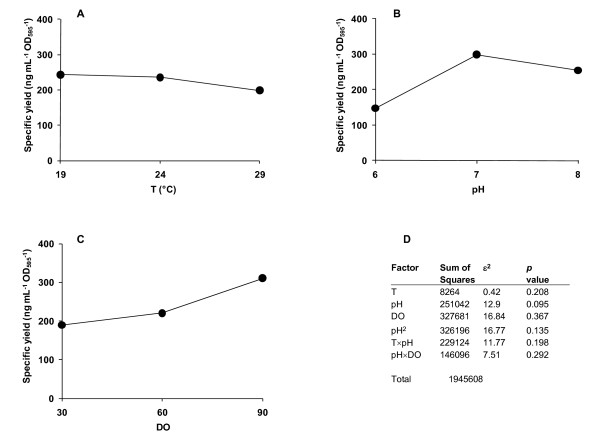
Figure 1.
Analysis of the model. A main effects plot showing the influence of each of the input variables (A) T, (B) pH and (C) DO on specific yield. Panel D shows the ε2 analysis which indicates the influence of each of the input factors and their interactions on the model. The value reported for ε2 is the quotient of the sum of squares for the factor and the total sum of squares (from Table 2) expressed as a percentage.

