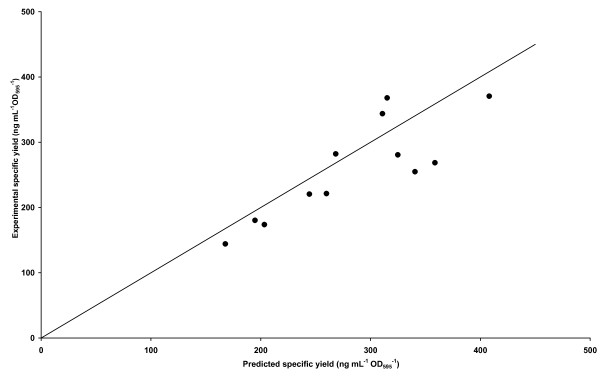
Figure 2.
Demonstration of the predictive capacity of the model. A scatter plot of predicted versus experimental specific yield from M24 cultures is shown. Each check point condition was from within the model design space, but had not been used to build the model, as detailed in the Methods section. The fit to the line of parity (y = x) is shown with R2 = 0.57.

