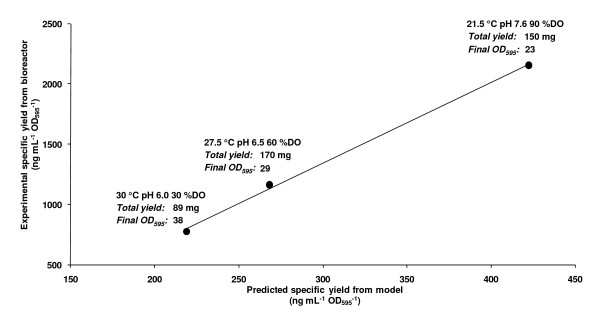
Figure 4.
Validation of the scalability of the model from 6 mL to 3 L working volume. Three sets of process conditions were scaled up in bioreactors; standard (30°C, pH 6.0, 30% DO), best experimental fit to the derived model (27.5°C, pH 6.5, 60% DO) and predicted optimal yield (21.5°C, pH 7.6, 90% DO). A scatter plot of predicted versus experimental yields are shown. The data fit to the line of best fit (y = 6.7016× - 669.41) with R2 = 0.99. Under each point, the final OD595 of the culture and the total yield of GFP are given.

