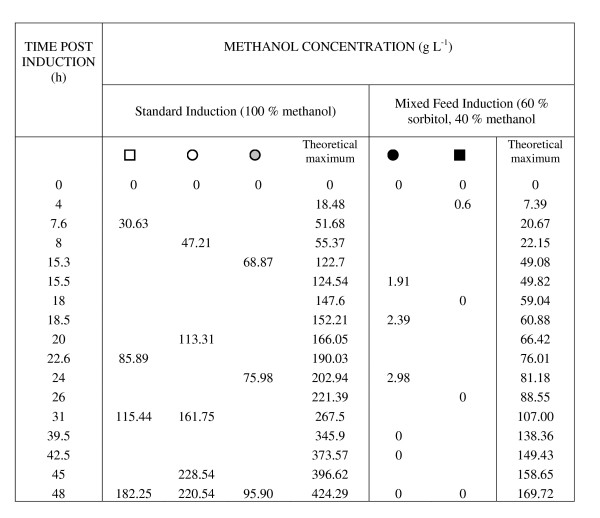
Figure 6.
Analysis of residual methanol concentrations from cultures in Figure 5. Residual methanol concentrations are shown in g/L. The theoretical maximum methanol concentration (if none had been metabolised) is presented for comparison. The symbols used in Figure 5 are used here to identify standard (squares) or predicted optimal (circles) production conditions. Glycerol concentrations of 10 g L-1 (white circles) and 40 g L-1 (grey circles) prior to induction with methanol under DoE-predicted optimal conditions are also shown. Standard conditions (white squares) are given for comparison. Black symbols indicate that the culture was grown with both 40 g L-1 glycerol and a mixed methanol/sorbitol induction regime.

