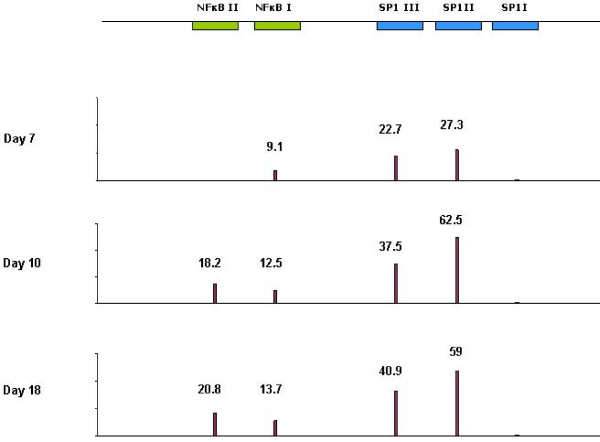
Figure 2.
Frequency of sequences harboring mutations in SpI and NF-κB binding sites over the time-course experiment. Diagram depicts an schematic representation of the NF-κB and SpI sites distribution in the HIV-1 LTR U3 region and the frequency (expressed as percentages) of sequences presenting mutations in NF-κB or Sp1 binding sites in relation to each time point.

