
Figure 1.
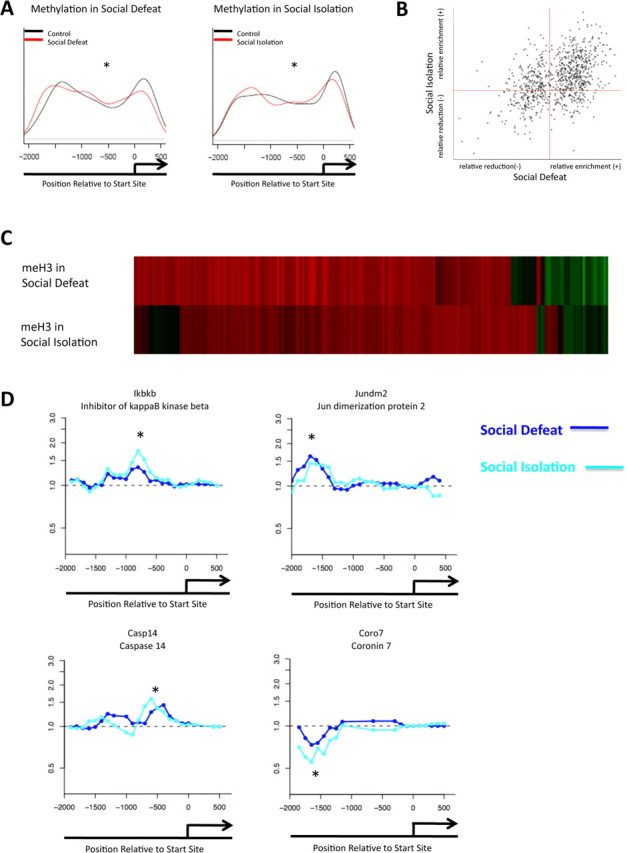
Similar regulation of H3 methylation in two mouse models of depression. A, Promoter plots show significant alterations in repressive dimethylK9/K27-H3 methylation in the NAc between control animals and those subjected to chronic social defeat or chronic social isolation. B, Positive correlation is seen between the two models for H3 methylation (p < 0.0001). C, The top heat map illustrates the fold change of H3 methylation in social defeat, compared with the fold change of H3 methylation of the same genes in the social isolation model. D, Patterns of H3 methylation at representative gene promoters. Light blue is social isolation; dark blue is social defeat. *p < 0.05.