
Figure 2.
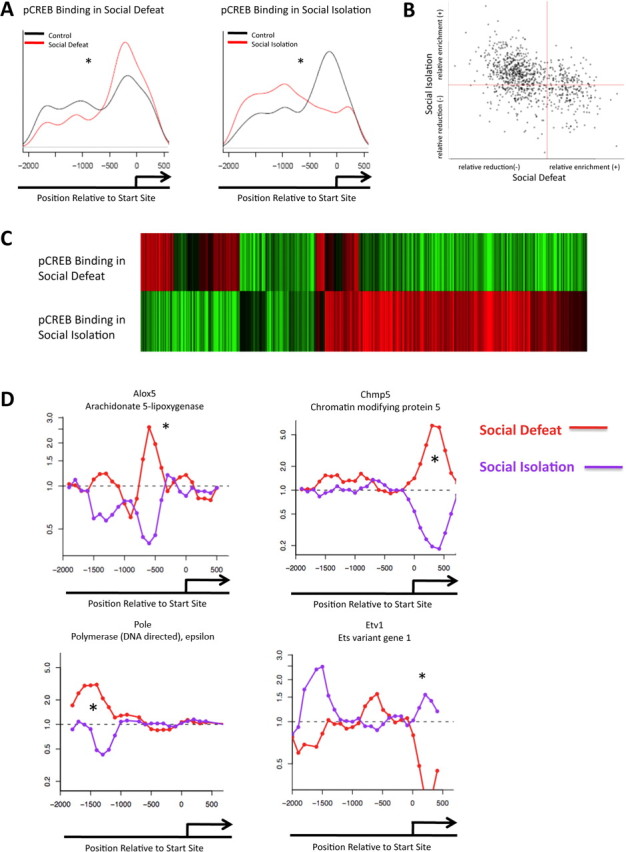
Opposite regulation of phospho-CREB binding in two mouse models of depression. A, Promoter plots show significant alterations in phospho-CREB binding in the NAc between control animals and those subjected to chronic social defeat or chronic social isolation. B, Negative correlation is seen between the two models for phospho-CREB binding (p < 0.0001). C, The top heat map illustrates the fold change of phospho-CREB binding in social defeat, compared with the fold change of phospho-CREB binding of the same genes in the social isolation model. D, Patterns of phospho-CREB binding at representative gene promoters. Red is social isolation; purple is social defeat. *p < 0.05.