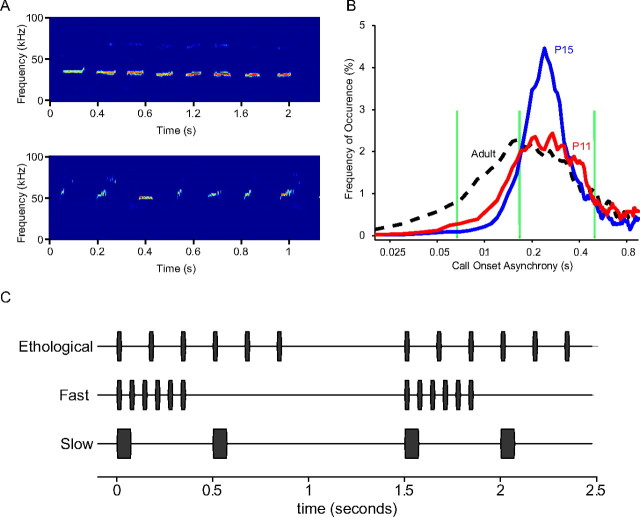
Figure 1.
Characterization of rat calls. A, Example spectrograms of a bout of rat pup isolation calls (top) and adult encounter calls (bottom). B, Distributions of COA within a bout. Green vertical lines indicate the COAs of the three experimental conditions: fast (15 Hz, COA = 0.067 s, far left), ethological (6 Hz, COA = 0.167 s, middle), and slow (2 Hz, CAO = 0.5 s, far right). C, A schematic of the stimuli used in the ethological, fast, and slow experimental-rearing conditions.

